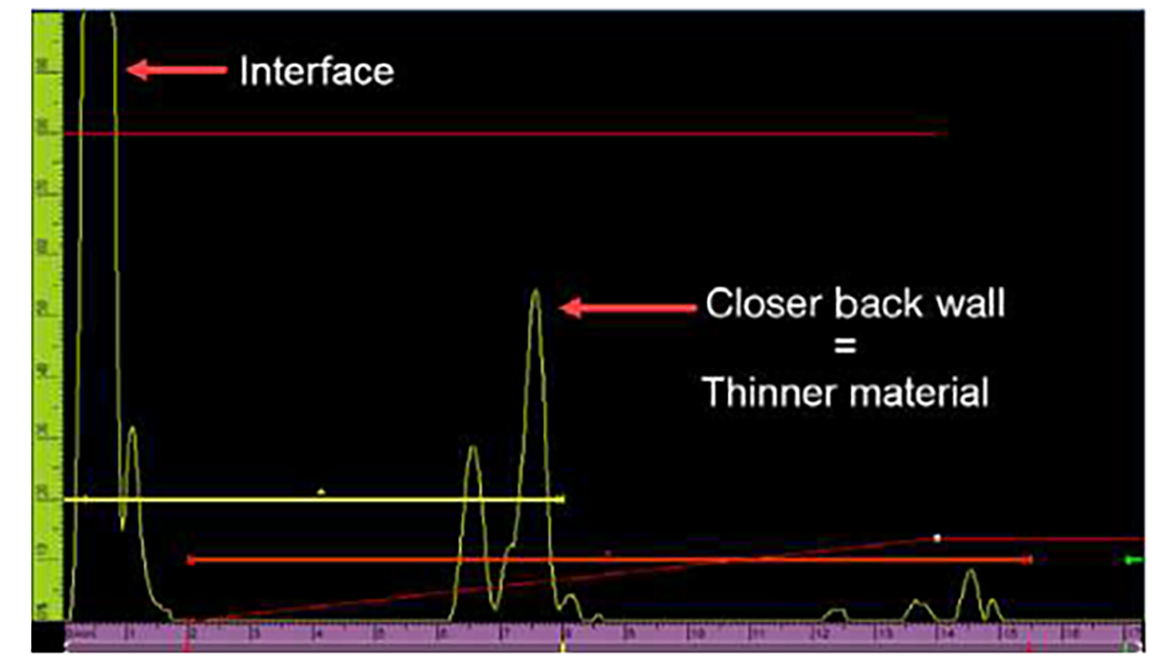
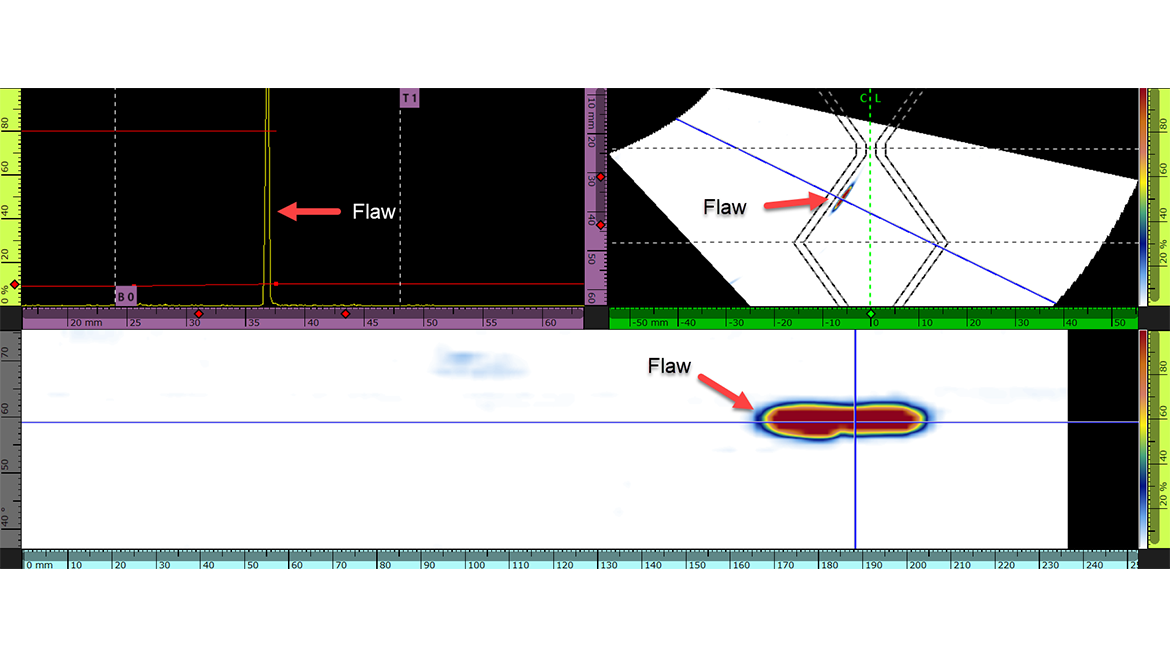
Phased array ultrasonic testing (PAUT) was long considered the gold standard to image flaws nondestructively in components. Offering a major advantage over conventional ultrasonic testing, PAUT provides 2D image representations of flaws in a weld as opposed to a mere A-scan signal that could be challenging to interpret (Figure 1). Phased array imaging made the understanding and analysis of flaws in a pipeline much easier, enabling inspectors to provide more valuable insights and information in their condition assessments without having to pause the pipeline activities (Figure 2).
As ultrasonic testing technology continues to evolve, imaging accuracy has greatly improved and, more importantly, detection and sizing of flaws has become easier owing to recent advances such as full matrix capture (FMC), total focusing method (TFM), and phase coherence imaging (PCI).
In the pipeline world, some flaws can be more challenging to detect because of their orientation in relation to the pulsed sound beam. When using conventional PAUT to inspect electric resistance welds (ERWs), commonly occurring flaws—for example, vertical lack of fusion, hook cracks, branched cracks, etc.—can be missed.
In the search for a solution for these hard-to-detect discontinuities, PCI has shown itself to be a useful tool. This is because one of PCI’s main strengths is detecting cracks that are vertical to the surface of the component.
How Does Phase Coherence Imaging Work?
To understand why PCI is so proficient at detecting vertically oriented flaws, it’s helpful to first review the basic principles of acoustic signal processing for conventional ultrasonic techniques and then compare it with PCI.
An ultrasound signal has an amplitude component and a phase component (Figure 3).
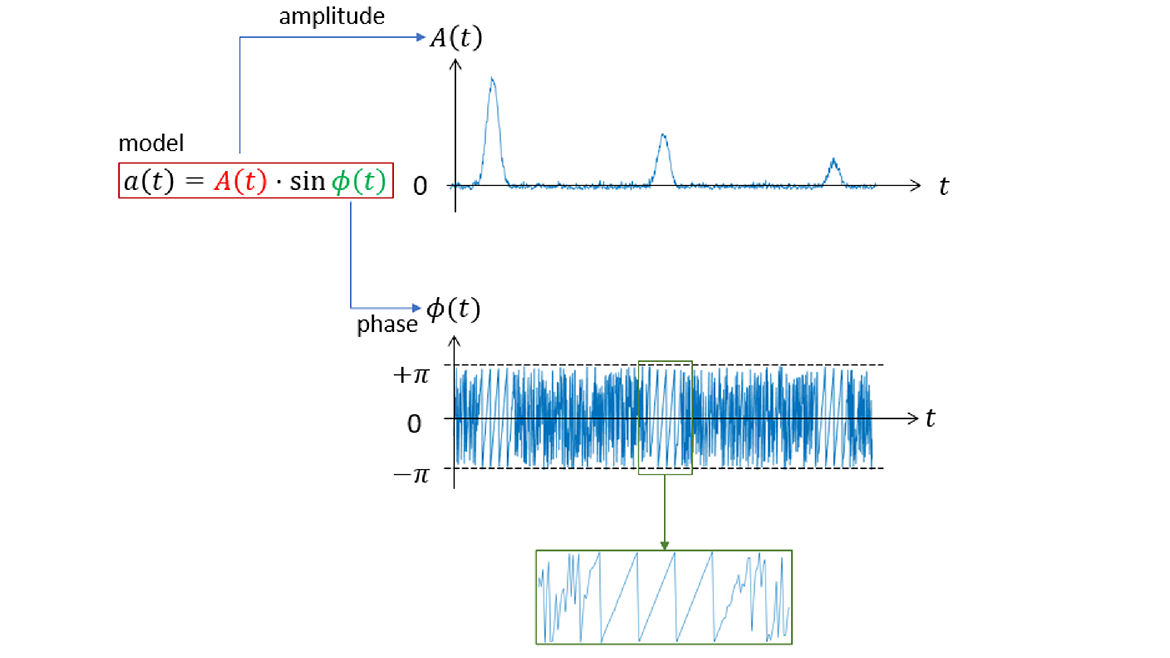
Figure 3. The amplitude component of an ultrasonic signal (top) versus the phase component of the same signal (middle). The zoomed-in portion (bottom) shows the phase response of an indication or flaw.
Most ultrasonic inspection data representations—from the basic A-scan to advanced TFM imaging—are generated by processing the returning amplitude of the signal. Variations in the strength of the signal amplitude are used to determine if flaws are present in the component inspected.
However, amplitude-based techniques have inherent limitations. For one, the sound beam needs to hit the flaw at a perpendicular angle for it to be properly detected. If the angle is not optimal, the returning signal will not have the requisite level of energy. On typical weld bevels (V welds and double-V welds), where the flaws usually occur on the bevel at approximately 30–35-degree angles, amplitude-based ultrasonic testing techniques are effective.
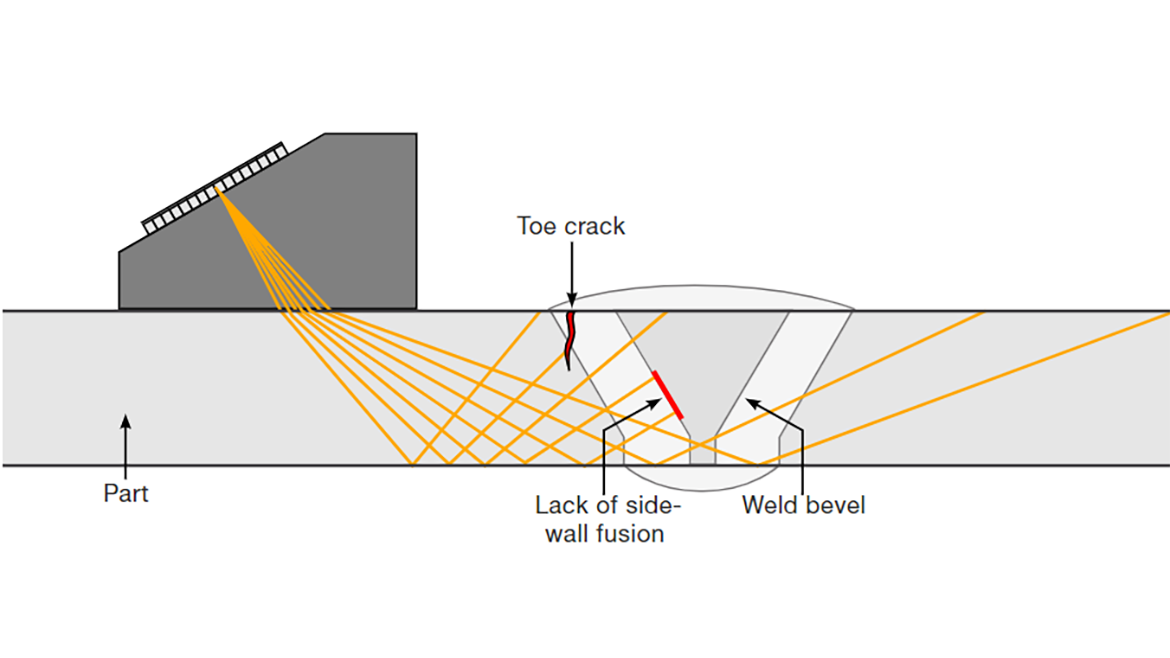
For vertical weld bevels or for flaws that are oriented parallel to the surface, detection can be challenging using these amplitude methods since the perpendicularity between the flaw and the ultrasonic beam is not always achievable (Figure 4).
A way to overcome this challenge was discovered by scientists who invented an alternative method to process the acoustic signals, one that is based on the variation in the phase rather than changes in amplitude. This new technology is called phase coherence imaging (PCI).[i]
Phase coherence imaging is considered a variant of the total focusing method (TFM), since it also uses full matrix capture (FMC) acquired data. Unlike conventional TFM, PCI discards the amplitude information in the collected elementary A-scan and only considers the phase information. Whereas amplitude-based methods such as PAUT and TFM require beam-to-flaw perpendicularity for proper detection, PCI is sensitive to flaw edges and tips at any orientation.
This increased sensitivity is mainly due to two factors. First, it’s a phase-based technique and the phase information of the signal is retrievable at the same intensity regardless of the number of legs in the sound path and the distance the ultrasound travels in the part. Second, the PCI algorithm contains a unique acoustic signal binarization component that sorts the elementary A-scan data according to the statistical distribution of phase coherence and incoherence for each point in the region of interest (ROI). Crack edges and tip diffractions produce highly coherent phase responses, while coarse-grained materials produce incoherent, chaotic phase responses. The higher the disparity between the coherence and incoherence, the higher the contrast between these reproduced signals in the PCI image.
This contrast between the incoherent phase response and the coherent phase response is shown in Figure 3. Compare the illustration of the signal phase to that of the signal amplitude above it, and you can see that the coherent portions line up with the peaks in the amplitude.
Easier Detection of Vertical Cracks
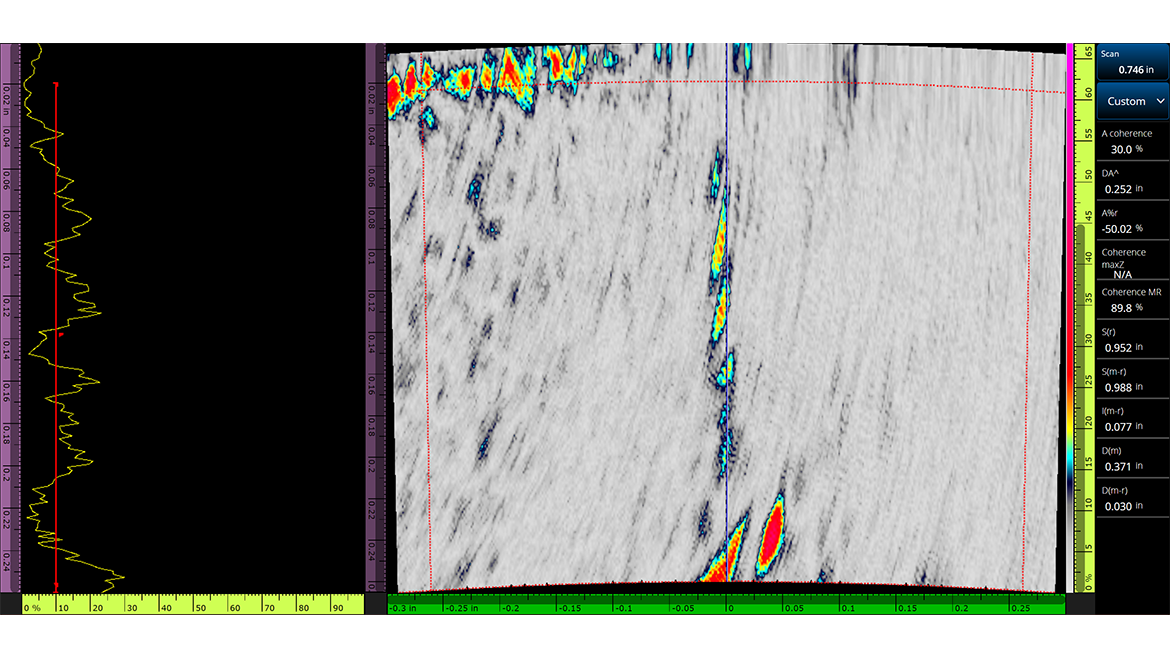
The images in Figure 5 were acquired by a nondestructive testing (NDT) service company during a pipeline integrity assessment that revealed a vertical crack in a weld. These images demonstrate the differences between conventional amplitude-based PA and phase-based PCI. They both show the same vertical crack found in an electric resistance welded (ERW) 16-inch diameter pipeline with a 0.250 in. wall thickness.
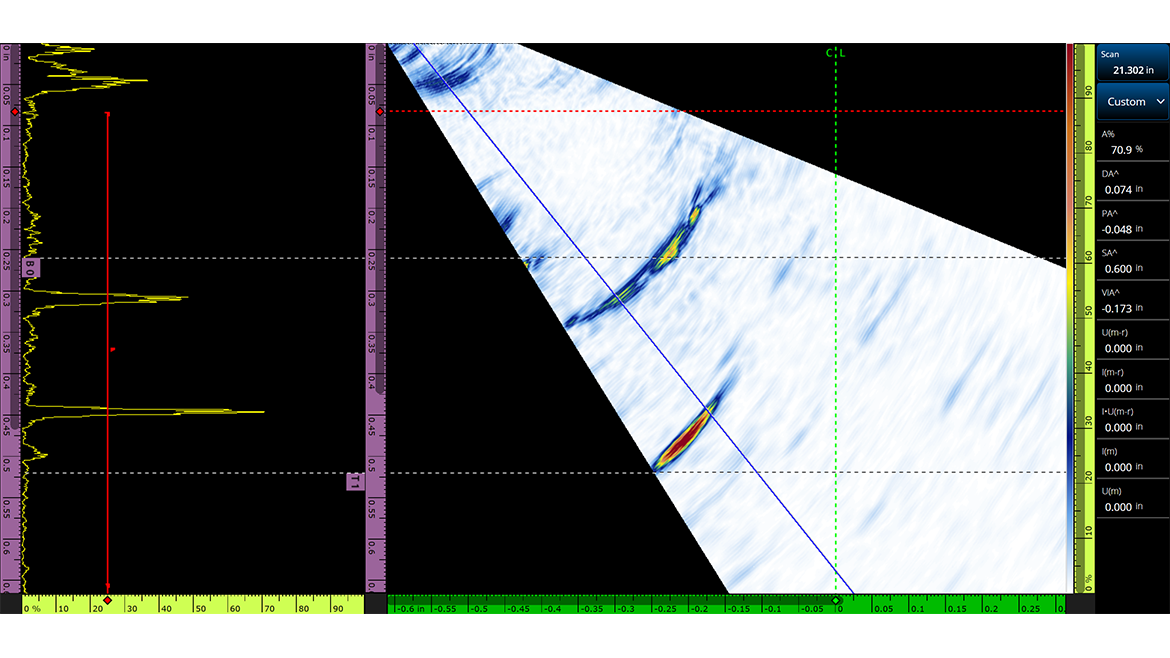
The phased array image (Figure 5a) detects a signal coming from the corner between the internal wall of the pipe and the edge of the crack (or “corner trap”) and shows diffracted signals that indicate the end of the crack (or “trip diffraction”).
The PCI image, on the other hand (Figure 5b), shows the crack in its entirety, including its faceted profile. An inspector can use the PCI representation to gain a clearer and more detailed understanding of what is happening in the pipe and achieve more precise flaw sizing. This then benefits the pipeline owners, as the improved accuracy of the inspector’s assessment enables them to make more informed decisions on the need to repair or replace their assets.
Simplified Flaw Sizing
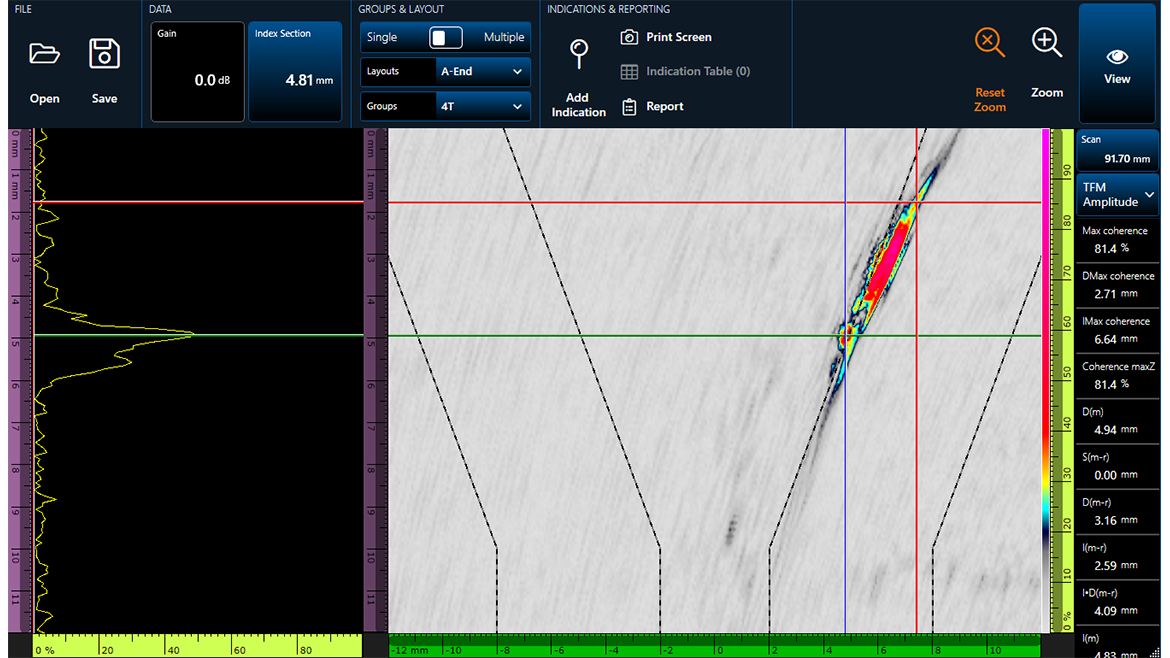
The complexity of flaw sizing is also significantly reduced using PCI compared with amplitude-based sizing techniques such as the 6 dB drop method. Tip diffractions have particularly high phase coherence so crack tips appear as obvious hot spots in the PCI results. For example, in the PCI representation of a lack of fusion (LOF) defect in Figure 6, an inspector can easily size the defect by placing the cursor on the maximum of the tip diffraction hot spots at the extremities. The acquisition instrument’s measurement reading provides the defect’s accurate size, without any adjustments required. It’s also highly repeatable—if the same probe is used, the defect size remains the same between each scan since there is no gain adjustment needed in this amplitude-free technique.
Summarizing PCI’s Potential to Solve Challenging Applications
Since the intensity of the signal phase information is consistent and unaffected by material and distance attenuation issues, PCI can effectively process the coherence to incoherence ratio of all the acquired data in equal measure. This is what enables PCI to successfully detect defect edges regardless of the angle and orientation in relation to the pulsed beams.
NDT
A Quality Special Section
The examples discussed here—a vertical crack and lack of fusion— are some of the more common yet challenging to detect flaws in pipeline integrity and engineering assessment applications. Hook cracks are another flaw type found in ERW pipes but are rarer. Hook cracks are formed in the manufacturing process through the combination of laminations or inclusions in the primary material, which are then rolled on the edges of the strip used for long seam ERW welds. Since hook cracks typically develop in a challenging orientation, PCI’s sensitivity to any diffraction also offers potential advantages in their detection.
It’s an application that needs to be explored.
In conclusion, using phased-based techniques such as PCI offers new detection opportunities for ultrasonic inspection, contributing to quicker, easier, and more accurate sizing results in pipeline weld inspection, especially for flaws that are challenging to detect due to their orientation to conventional phased array ultrasonic beams.